
Views: 0 Author: Site Editor Publish Time: 2026-11-19 Origin: Site
Failure rate is not one number. DOA, early-life failure and annualized failure rate (AFR) use different denominators and time windows; mixed definitions are not comparable data.
Amplifier failures cluster at both ends of the bathtub curve. The first 90 days are process failures; after year three, electrolytic capacitors take over.
At 1% AFR, every 1,000 warranted units means 10 RMAs a year, and one cross-border RMA typically costs a multiple of the unit's material cost (industry magnitudes, not a quotation).
Outgoing AQL sampling cannot catch wear-out, ESD latency or isolated solder defects. Field data is the only evidence that closes the loop.
Judge a factory by its traceability, not its claimed percentage. Batch traceability, per-unit test records and a failure-analysis loop are the three verifiable things.
A 1% annual field failure rate means 10 warranty repairs per 1,000 units in service each year — and, at industry-typical magnitudes, each cross-border RMA costs a brand several times the unit's material cost once freight, labor, parts and paperwork are counted. The invisible half of the damage is channel trust.
The most common accident in sourcing conversations is also the cheapest to avoid. A buyer asks "what's your failure rate", the factory answers "under 1%", and both walk away believing they discussed the same thing. They did not:
Definition | What it measures | Denominator | Typical magnitude (industry-general) | What it tells a buyer |
|---|---|---|---|---|
DOA rate | Dead or incomplete on arrival | Units shipped in the batch | Within a few per thousand | Packaging, assembly and outgoing-test discipline |
Early-life failure rate | Failures in the first 30–90 days | Units shipped in that window | A few per thousand up to ~1% | Whether burn-in and ESD control are real |
Annualized failure rate (AFR) | Warranty repairs as a share of units in service | Average annual warranted base | 1–3% is common; good operators run lower | Long-term design margin and warranty cost |
Each answer is legitimate; each describes a different capability. A supplier who quotes a low DOA rate and goes quiet on AFR has answered "nothing was broken when it left" and left "does it still work in year two" untouched. Ask for the definition before the number — that single question filters out most market vagueness.
The reliability bathtub curve shows up in amplifiers almost textbook-perfect: high at both ends, flat in the middle. Early failures — cold solder joints, assembly stress, incoming-lot problems, latent ESD damage — are birth defects, and burn-in screening exists to precipitate them before shipment. Failures after year three are aging: electrolytic capacitors drying out, solder joints fatiguing through thermal cycling, relays and potentiometers wearing.
Failure period | Typical window | Dominant mechanism | What the factory controls |
|---|---|---|---|
Early life | 0–90 days | Process defects, incoming material, latent ESD | Burn-in, per-unit electrical test, tightened incoming inspection |
Random / useful life | 90 days – 3 years | External stress: mains surges, transit, misuse | Design margin, protection circuits, installation guidance |
Wear-out | Year 3 onward | Capacitor dry-out, solder fatigue, mechanical wear | Capacitor derating, thermal design, serviceable construction |
One corollary deserves more attention: both ends of the curve can be engineered flatter. The early-life hump depends on how thoroughly burn-in precipitates defects; when the wear-out end arrives is largely set by capacitor specification and operating temperature. The rule of thumb — electrolytic capacitor life roughly halves for every 10 °C rise — means the same design can show very different field data in a ventilated rack and a sealed one. Installation environment and climate therefore belong in any AFR comparison between suppliers.
The table below collects the failure modes that recur in amplifier service returns across the industry, roughly in order of frequency (general industry knowledge, not any single company's data). Each is paired with a verifiable process — which is what makes the table usable at a factory audit rather than merely descriptive.
Failure mode | Mechanism | Typical window | Verifiable process behind it |
|---|---|---|---|
Electrolytic capacitor failure | Electrolyte dry-out, rising ESR, bulging | Concentrated after year 3 | 105 °C-rated parts with derating; incoming inspection |
Solder joint cracking | Thermal cycling fatigue on power devices | Years 1–5 | Reflow/wave parameter records; AOI |
Protection circuit nuisance trips | Thresholds set too tight; relay sticking | Random | Per-unit protection test records |
Output stage thermal failure | Poor heat-sink contact, insufficient derating | Clusters in hot environments | Torque-controlled stations with records; temperature-rise testing |
Potentiometer / encoder noise | Wear, oxidation | After year 2 | Incoming life sampling; replaceable design |
Connector loosening or oxidation | Insertion cycles, plating thickness | Random | Terminal incoming checks; insertion-force sampling |
Latent ESD damage | Assembly-phase discharge, delayed failure | Early-life period | ESD floor, wrist-strap and ionizer check logs |
Transit damage | Drop, vibration, moisture | Shows up as DOA | Packaging drop-test records |
Mains surge damage | Inadequate input-stage protection | Storm seasons | Surge test items |
Firmware lockup / standby faults | Control logic defects | Early-life period | Per-unit standby and function test records |
Nothing on this list is mysterious. Every failure mode maps to a process step and a record — the foundation of the evidence section below.

Typical construction of a multichannel amplifier front panel (illustrative only)
Converting 1% AFR into operations makes the number concrete. The following walks a common structure — 1,000 units shipped, two-year warranty — at illustrative magnitudes (no quotation implied):
Item | Working | Notes |
|---|---|---|
Repairs per year | 1,000 × 1% ≈ 10 units (year one) | The warranted base grows in year two |
Reverse logistics | 10 cross-border or regional round trips | Cross-border adds customs and paperwork hours |
Diagnosis and repair labor | 0.5–2 hours per unit | Complex units run higher |
Parts cost | Depends on the failed stage; capacitors cheap, power stages dear | Often estimated as a share of unit material cost |
Replacement shipping | Depends on warranty strategy | Swap-out policies double the freight |
Fully loaded cost per RMA | Industry-typical estimates run at 1.5–3× the unit's material cost | Magnitude only, not a quotation |
The takeaway is the multiple, not the absolute figure. Repairing is structurally more expensive than preventing, and that scissors gap is the negotiating leverage behind reliability and warranty clauses. Cutting failure rate from 1% to 0.5% does not save the cost of five units; it saves the full cross-border process cost of five RMAs.
Add the time dimension and the stakes compound. Failure rate follows the warranted base: a brand shipping 4,000 units in year three faces roughly seven times year one's repair volume even at a constant AFR. Reliability work therefore has to be finished before the volume ramp — every process investment, and every process flaw, is multiplied by the shipping curve.
The same "1%" can describe wildly different repair loads depending on the denominator. The second question to ask, right after "which definition", is "which denominator":
Denominator | What it counts | Effect on 1% |
|---|---|---|
Current-period shipments | Only what was sold that year | Numbers "improve" in slow seasons |
Activated installations | Units actually powered up | Closest to real stress |
Average annual warranted base | Rolling units inside warranty | Two-year warranty ≈ rolling sum of two years of shipments; the largest base |
Complaints over shipments | Only customers who spoke up | Silent attrition is excluded; the number collapses |
The last one is the dangerous one. Complaints understate actual failures by a wide margin — that is settled industry knowledge — so a complaint-derived rate can look almost perfect while being meaningless. The comparable figure is AFR computed on the average warranted base with failures assigned to the year they occurred. Asking a supplier to state the denominator and the year-assignment rule in writing removes most of the room for salesmanship.
Asking generically for "a failure rate report" returns a tidy one-pager. Verifiable field data has a specific evidence shape — every item below exists as a document in a factory running a real reliability system:
Evidence to request | What it looks like | What it proves |
|---|---|---|
Batch traceability records | Serial or lot numbers traceable to materials and stations | A failed unit can be pinned to a day, a line, a material lot |
Per-unit test archives | Outgoing electrical values (power, distortion, standby) bound to serial numbers | Shipped condition is auditable, not rubber-stamped |
Burn-in screening records | Rack positions, duration, pass/fail per unit | Early failures are being precipitated systematically |
RMA analysis reports | Returns classified by failure mode, with root causes | The factory analyzes rather than swaps and forgets |
8D / corrective-action records | Problem → root cause → action → verification | Failures close the loop and do not recur |
Warranty terms and liability split | What counts as a manufacturing defect; who pays which freight | There is something to negotiate when it happens |
A practical litmus test: a genuine factory can put its hands on the return-analysis file for a specific past batch, even when the data is unflattering. "Ugly but documented" outranks "beautiful but archival-less" by an order of magnitude. A supplier who offers only "our failure rate is very low" has failed this section.
Brands often model a repair as the cost of a capacitor. The real structure is longer — a cross-border RMA broken into its usual stages (magnitudes illustrative throughout):
Stage | Cost items | The part people forget |
|---|---|---|
Return freight | Express or sea freight, insurance | Declared value and duties |
Import paperwork | Repair declarations, duty-relief applications | Some markets run re-export-after-repair in months, not weeks |
Diagnosis | Labor plus instrument time | Unreproducible faults consume the most hours |
Repair / parts | Materials and labor | Discontinued components need substitution work |
Forward freight | Replacement or repaired return | Swap-out policies route it as a new unit |
Channel handling | Distributor labor, customer communication | Billed by the hour by service contractors |
Resale discount | Repaired units no longer sell as new | Refurb discounts often exceed the repair cost itself |
Summed across seven stages, this is what "one repair" actually costs. Multiply by annual RMA count and compare against the contract-side alternative — tighter burn-in, complete per-unit test archives, a written failure-analysis obligation — and in most cases the preventive side is dramatically cheaper. That is the case for treating failure rate as a sourcing KPI rather than an after-sales metric.
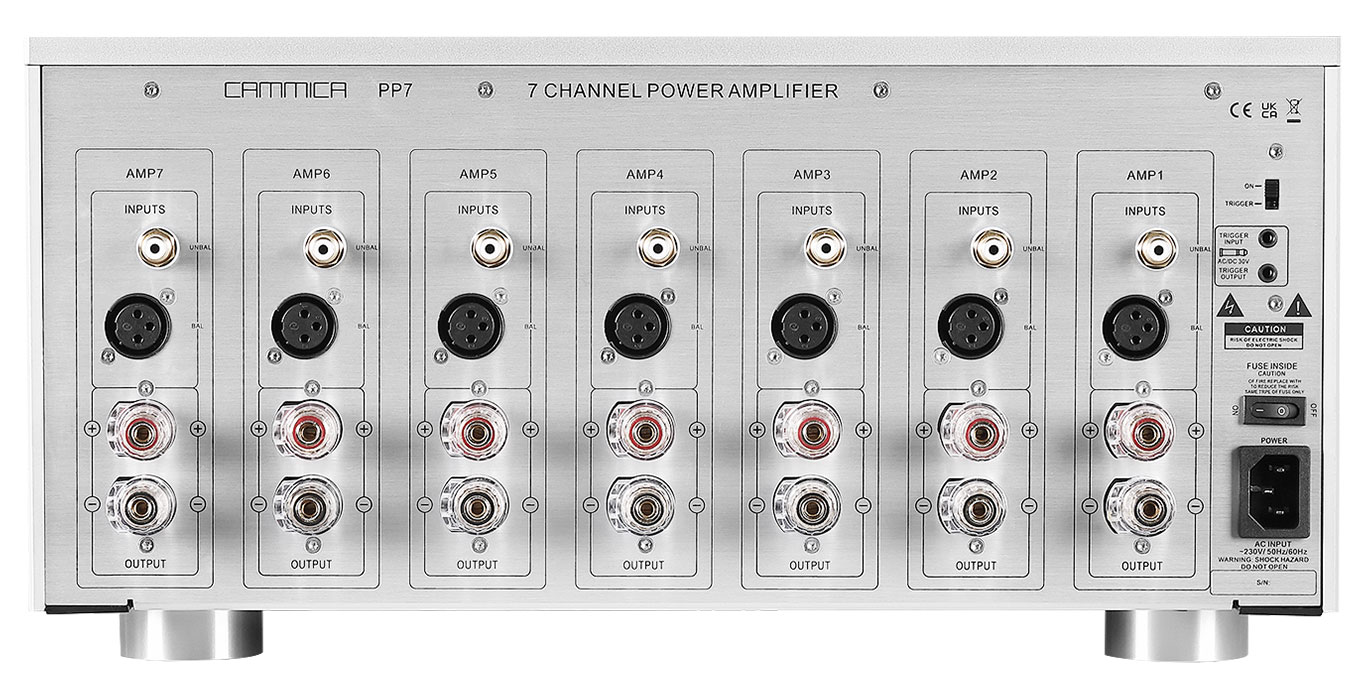
Typical rear panel terminal layout (illustrative only)
The accounting-visible costs are only half the bill. Three invisible entries usually run larger:
Reviews and reputation. One "died after eight months" review consumes more advertising spend than the RMA ever cost; for a B2B brand, dealer-level returns shake reorders directly.
Repurchase and channel trust. Failure-rate reputation circulates among wholesale buyers, and one batch-quality incident can redirect a quarter's new inquiries to a competitor.
Emergency replacement. Air-freighted swaps, expedited production and on-site firefighting are unplanned spend that also disrupts the schedule.
What these three share is that none appear in a repair report, yet all are driven by failure rate. Which is why mature brands write AFR into annual supplier reviews instead of waiting for the incident.
AQL sampling is the last gate before shipment, and its limits are routinely overestimated. It catches batch-scale, visible, or instantly reproducible defects. Three classes of failure pass straight through:
What sampling misses | Why | What actually catches it |
|---|---|---|
Wear-out failures | Capacitor dry-out takes years to appear | Capacitor derating and thermal design |
Latent ESD damage | The unit tests fine at shipment, fails months later | Process-wide ESD control, not sampling |
Isolated solder defects | Sampling ratios cannot hit single-point defects | Controlled process parameters plus full AOI |
The conclusion is not that AQL is useless — it is that outgoing quality is sampled, while in-service quality is designed and controlled. Brands that conflate the two discover the gap when the first wave of early-life failures arrives, with all sampling reports green. The audit sequence is: process stations and records first, outgoing test second, the sampling plan last. Run the order backwards and you will see what the supplier chose to show you.
Failure rate is not lowered in quality meetings; it is lowered by stacked process steps, each verifiable on the floor:
Incoming: electrolytic capacitors specified at 105 °C with derating margin; critical materials inspected lot by lot, records kept.
Process: reflow and wave parameters controlled and archived; AOI on every solder joint; torque-controlled fastening stations with records — heat-sink contact pressure directly sets thermal resistance.
Screening: every unit powered through burn-in so early failures precipitate inside the factory; results archived per unit.
Test: per-unit outgoing measurement of power, distortion, SNR, standby draw and protection behaviour, bound to a serial number.
Environment: ESD flooring, wrist straps and ionizers on a check schedule; temperature-rise validated at design freeze.
Underneath all five sits one capability: records that persist and traces that resolve by serial number. Without traceability, every claim of quality culture is a gesture. With it, failure rate becomes a number that can be discussed, improved and written into a contract.
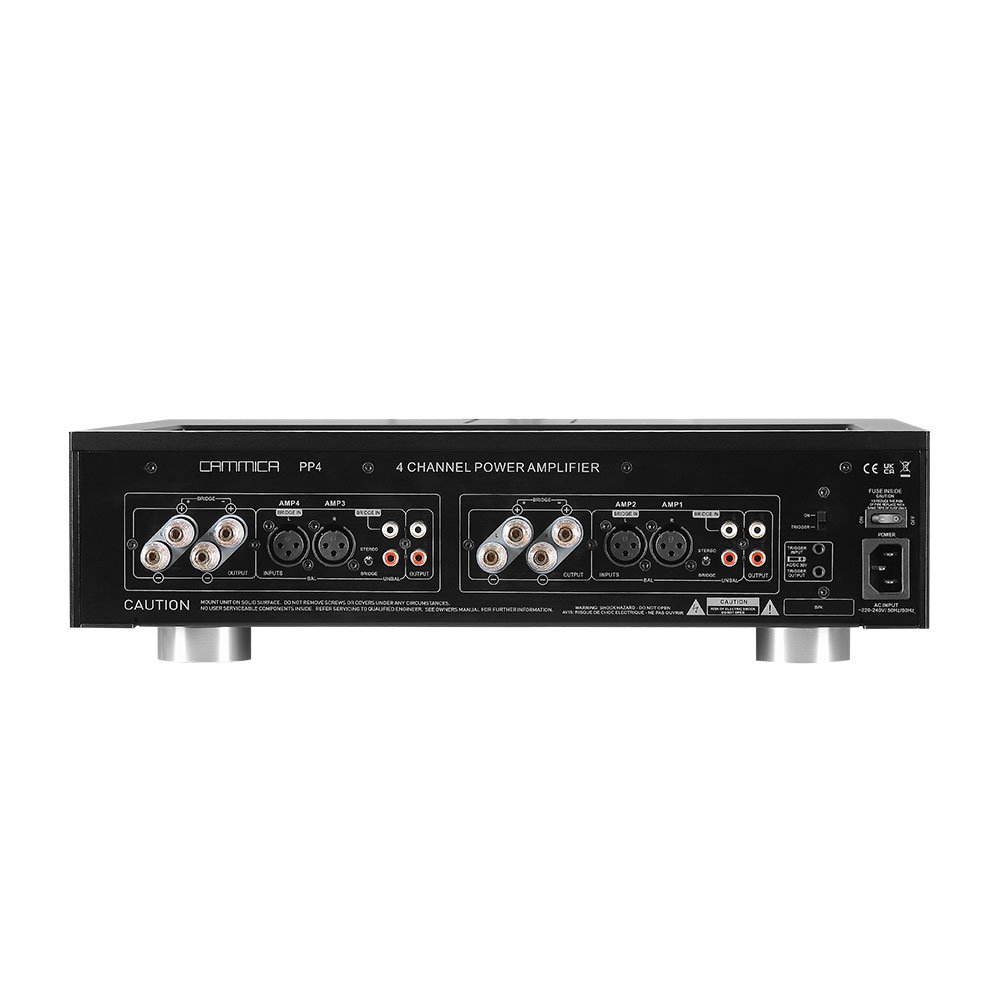
Typical front panel of a multi-channel power amplifier (illustrative only)
The number of returns does not determine whether reliability improves; the quality of the loop does. A complete failure-analysis sequence runs like this:
Step | Action | Output |
|---|---|---|
1. Reproduce | Confirm the reported fault; unreproducible cases go into a separate environmental/random bucket | Failure confirmation record |
2. Locate root cause | Teardown analysis down to a material lot, a process step or the design | Root-cause conclusion with evidence |
3. Quarantine the batch | Screen every in-stock and in-transit unit sharing the suspect material | Quarantine list |
4. Correct | Change process parameters, incoming standards or design | 8D report |
5. Verify | Confirm with data from subsequent batches | Verification data |
6. Extend | Check sibling models and shared process steps | Horizontal-deployment record |
Two questions expose whether a supplier's loop is real: "Can you still retrieve the 8D number from the last similar failure?" and "Do you have post-correction return data from the affected batch to compare?" Two yeses mean the loop runs; two hesitations mean returns are a swap-and-forget pipeline.
Q1: Is the gap between 0.5% and 1% AFR really that significant? On a 1,000-unit warranted base it is five cross-border RMA processes per year instead of ten. At industry-typical magnitudes, that difference usually exceeds what it costs to secure tighter process control in the contract.
Q2: A supplier says "our failure rate is under 1%." What do I ask next? Three things: which definition — DOA, early-life or AFR; which denominator — shipments or average warranted base; and whether they can show RMA analysis records. Any missing answer means treat the number as marketing.
Q3: How long should burn-in run to be effective? Long enough to precipitate early failures: hours-scale high-temperature powered soak combined with per-unit judgment. Duration varies with power level and device ratings and should come from design-freeze validation.
Q4: Does a 2-year versus 3-year warranty change the conversation? Warranty length inflates the warranted base, and RMA volume scales with it at any constant AFR. Longer warranties must stand on process control and per-unit test archives — otherwise the promise just reallocates risk onto your books.
Q5: Can a supplier refuse to share field data because it covers other customers? Project identities can be masked, but failure-mode statistics, root-cause conclusions and corrective actions are evidence of the factory's own capability. A reliability system in normal operation can produce them.
A 1% field failure rate is ten full RMA processes per 1,000 warranted units a year — plus a hidden ledger of reviews, channel trust and emergency spend. It is driven by the two ends of the bathtub curve, pushed down by process control across incoming, assembly, screening, test and environment, and kept honest by traceability and a closed failure-analysis loop. The buyer's move comes down to three: align the definition, demand verifiable evidence, and put AFR into the annual supplier review.
To see these steps on a working line — burn-in positions, test stations, torque records — start with the production floor and per-unit test archives behind these records; our reliability and sourcing series is collected in factory-side notes on amplifier reliability and build quality; the product ranges built under this system are listed in the amplifiers and home-cinema lines we build today.


